Make a dot-matrix world map from scratch
Recently, many people have seen the map I put on my home page and asked me how I did it or what plug-ins I used.
This map was first created by my blog revision a few years ago, when I wanted to mark all the places I had visited and dream of when I could light up the map of the whole world.
Recently, I took time to sort out the whole map development process and put this project on Github (https://github.com/zmofei/point-map) (don't forget to give a Star if you like this repo~)
Make a dot-matrix world map from scratch
When I wrote this article, I decided to start from scratch, that is to say, you just need to master JavaScript, not even data, and you can understand a complete process. If you have strong hands-on ability, you can even write a library like this. If you want to test the entire data processing process, you may need to install a powerful tool of the GIS industry QGIS, but this is not necessary. I also retain the processed data in the project's data directory, which you can use directly.
Overall thinking
To achieve such a map, the most critical first step is how to get the dot matrix data representing the land. Such data can rarely be downloaded directly, so we need to process it in our own way. The way I use here is to extract these lattice data from the boundary data of the world's land through some of Canvas's tricks, then customize our own coordinate system according to these lattice data, and finally draw the lattice and the points representing events through Canvas, and complete it.
1. Dot matrix data
1.1 Get the data
It is difficult to get directly available data. Fortunately, as programmers, we can create available data by ourselfs with some boundary data of the world.
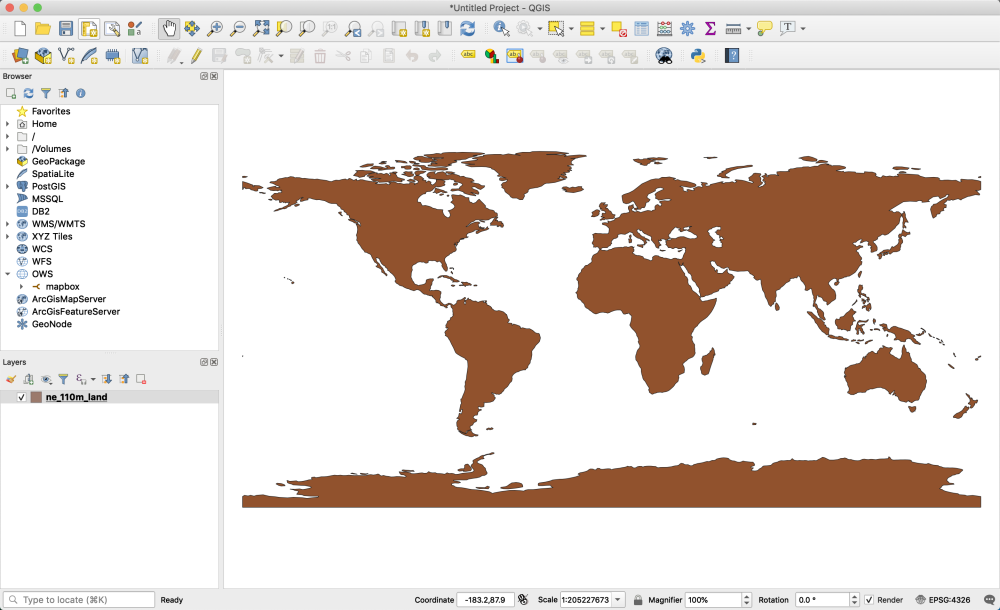
Border data can be downloaded through the Natural Earth website, which has many data on common scale geographical boundaries or "cultural" boundaries. Since the lattice map does not require high accuracy, we only need to download 1:110m Physisical data. The downloaded data is a file in Shapfile format. We can open it through QGIS.
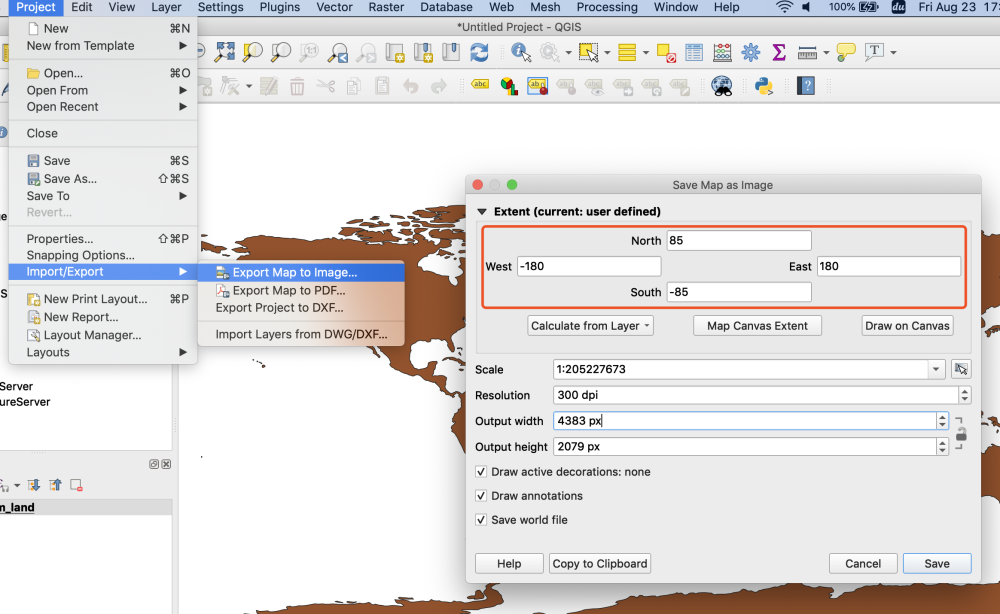
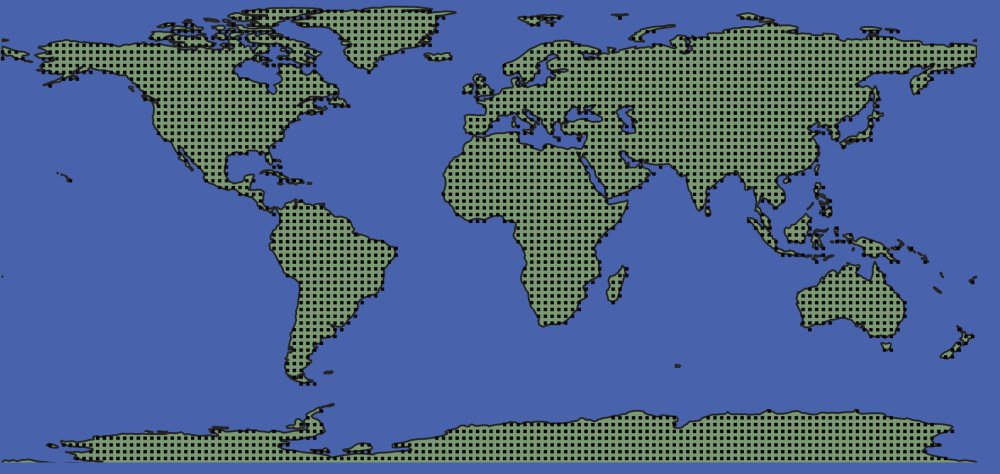
Because we need to recognize land through Canvas, we first export it to the image format through QGIS. We need to note that here we must record the range of the images we export in order to prepare for the subsequent coordinate system. As shown in the following figure, the scope of our derivation is [W:-180 degrees, N:85 degrees, E:180 degrees, S:-85 degrees]
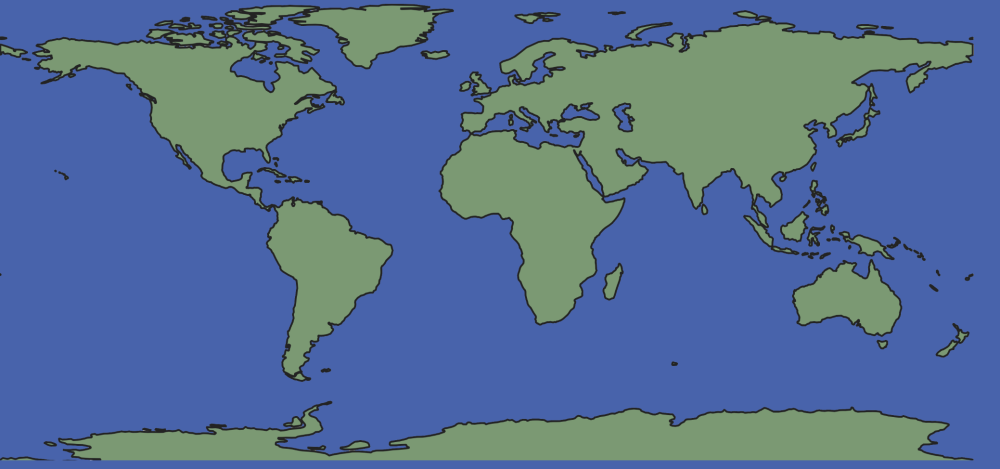
Next, we can use PS (Photoshop) to simply cut out the white ocean part of the picture. Of course, because the white background is very different from the color of the land itself, you can easily distinguish it by code, so this step can be not necessary here we do it for better visualization.
1.2 Data Processing
Next, it's time for the code to show its magic power. I also put the relevant data processing code in Github's data directory for reference.
In order to identify the mainland on the picture, we first use Canvas to draw the picture onto the canvas, corresponding code, which mainly uses the ctx.drawimage method. After drawing, it should look like this.
After drawing, we can get the RGBA value of each pixel point through Canvas's getImageData (specific code here) and then go through each pixel point, if the both of the R,G,B is zero (if you did not cut the white background in the previous process, you need to judge that none of these three values are 255), then it means that the place is land.
In addition, since the final format of the data we want to get is the dot matrix, each dot has its own width, and there is a certain distance from other points, so we do not need to get the value of each pixel, just set a gap between the dots, such as the girdWidth value in the code, and then according to this value pick up a dot. Finally, we can get such a dot matrix data of the land. If these draw it out, they should look like this.
In addition, in [data/extradata.js](https://github.com/zmofei/point-map/blob/62d7160fcc585291253182808 bfd221b853b9df7/data/extradata.js), I have output the data to the console. If you want to view it, you can directly open data/extradata.html to see the console output.
1.3 Data Compression
Through the above method, we can get a series of data. After this we are think about how to save these data, I made several simple optimizations and compressed the data to the original 12%.
1.3.1 1st Generation, use [x,y] to save data
Since the data is composed of X and Y coordinates, the simplest idea is to store the data directly in an array. In this way, we get the results of the first generation of data:
[
    [0,7],[0,8],
    [1,7],
    [2,7],[2,8],
    [3,8],
    [6,8],[6,9],[6,10],
    [7,6],[7,7],[7,8],[7,9],[7,10],[7,12],[7,65],
    [8,6],[8,7],[8,8],[8,9],[8,10],
    //...
]
Calculated by number of characters using JSON. stringify().length(ignoring space wrapping) there are 27447.
1.3.2 2nd Generation stores X values using an array index
After observing the data for a period of time, we find that almost every column will have the matrix data (in very few cases, a column has no data at all), and the data of each column will have duplicate X values, so can we use the index of the array to store X values? After a series of modifications, we get the following second-generation data results:
[
    [7,8],
    [7],
    [7,8],
    [8],
    [],
    [],
    [8,9,10],
    [6,7,8,9,10,12,65],
    [6,7,8,9,10],
    //...
]
Although there are some empty arrays [], because we remove the X value which has a lot of repetition, the character length of our results has been reduced from 27447 to 9754, which has reduced the data of 64%!
1.3.3 3rd Generation Consolidated Incremental Y Value
Looking at the data again, we find that since most parts of the mainland are continuous, it is easy to have partial continuous values like [6, 7, 8, 9, 10, 12, 65] in the data. Can we find a way to merge continuous increments? We decided to use two-dimensional arrays to represent continuous incremental data, such as the first five in [6,7,8,9,10,12,65] are continuous incremental values starting from 6, so we can use [6,5] to represent these five values, of which 6 is the starting value and 5 is the continuous five bits. So [6,7,8,9,10,12,65]=> [[6,5], 12, 65], so get the third generation data:
[
    [[7,2]],
    [7],
    [[7,2]],
    [8],
    [],
    [],
    [[8,3]],
    [[6,5],12,65],
    [[6,5]],
    //...
]
In the third iteration, we reduced the string length of the result from 9754 to 3345, and reduced the data of 66%! Through three iterations, we reduced the data from 27447 to 3345, reducing the data by an astonishing 88%! Can we continue to reduce it? The answer is yes, but due to the time, we have not continued to optimize.
Two key optimization codes can be referenced specifically /data/extradata.js's #L27 #L46-L57
For compressed data decompression algorithm in /src/helper.js's dataDecode function
2. Realization
After getting all the data, the next step is the most important drawing step. If you are familiar with Canvas, the whole process is not really very complicated. Here we briefly talk about the key points of drawing with the code.
2.1 coordinate system
Although our current version does not require complex mapping interaction, such as zooming, dragging, etc., it is necessary to establish a simple coordinate system in order to make the dots in each dot matrix display properly, and subsequently add event points through latitude and longitude. Combined with our first step to extract the parameters of the lattice, we use a BBOX (boundary points, usually record the left bottom and right upper) and a grid field to represent our map area.
this.coordinate = { bbox: [-180, -85, 180, 85], grid: 2.5 }According to this bbox, we can calculate that the longitude span of the whole map is from -180 to 180 that's 360 and the north and South latitudes is from -85 to 85 that's 170. Then the grid parameter is used to mark the size of each grid. Here we use every 2.5 as a grid, roughly. The diagram is as follows:
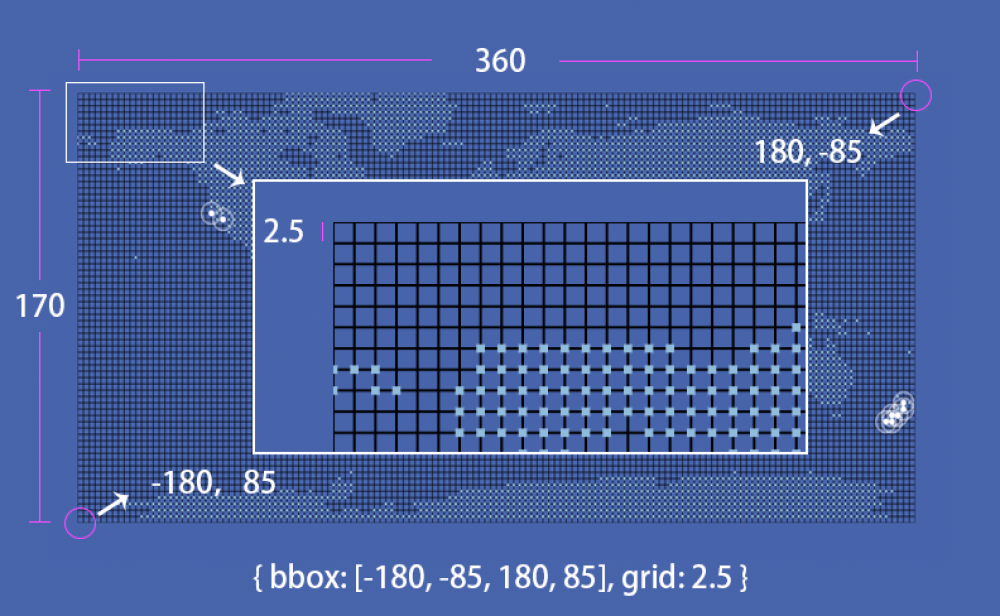
With the above concepts, we can calculate the number of meshes we need to draw.
- The East-West spanning longitude and latitude (360)/the size of each grid (2.5) can get how many grids per row, that is (360/2.5 = 144)
- Similarly, it can also calculate how many rows of grids there are that's (170/2.5 = 68)
Knowing the number of rows and columns in the grid, and then getting the actual length and width of the canvas, it is easy to calculate the size of each grid (grid width = canvas width / grid number).
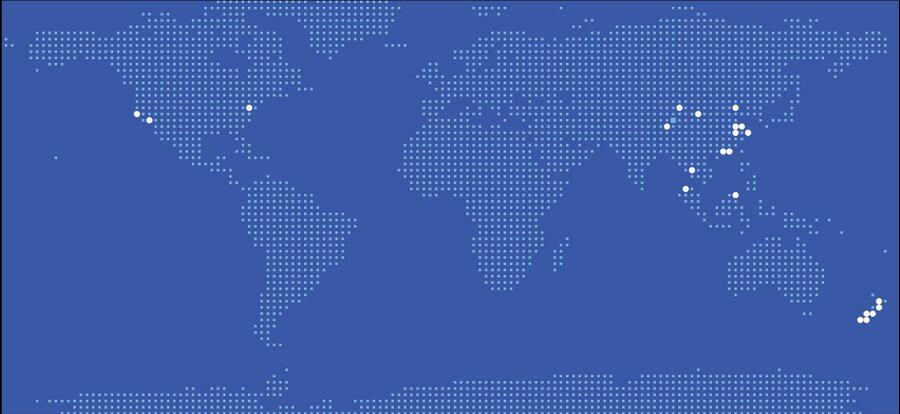
Direct from the effect map, we can see that the lattice map is divided into several layers as follows:
- Background lattice
- Highlighted points of the mouse (when the mouse moves on the map, the crossed points will be highlighted)
- The central highlight of the event
- ripple effect of event animation
In most cases, we can draw each layer sequentially, and then animation has been achieved through the requestAnimationFrame. However, considering that our background is almost unchanged after being drawn on the map, we can adopt a combination of static and dynamic methods to draw the animation effect and non-animation effect separately, which can reduce the consumption of non-animation effect drawing.
So we divide the whole map into two off-screen Canvas and one that will eventually be displayed.
Off-screen Canvas1: Mainly used to draw map bottom, mouse hover point, and event center point:
The code is here drawBasicMap() drawEventPoint
Another off-screen Canvas2 is used to draw bubbles:
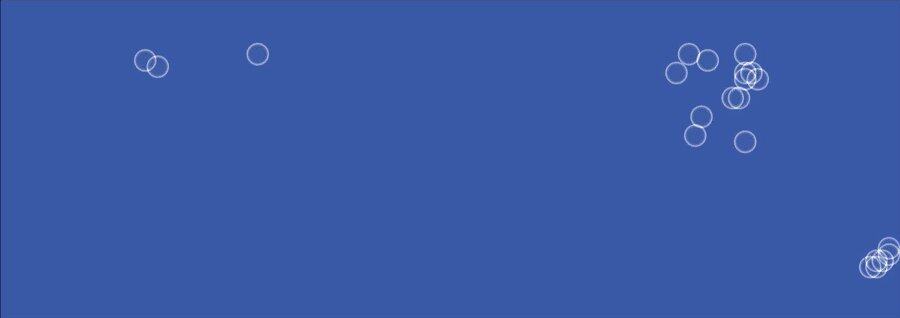
The way to draw bubbles is not much to say here. If you need to leave a message after the article, I will write another article if necessary. Corresponding code address: drawEventPointWave()
Finally, we just need to put these two steps of off-screen Canvas together and we're done!
End
Finally, all the projects are simply concluded by adding some common methods, such as:
- on() binding event
- remove() removal event
- addEvent() Add events
- addEvents() batch add events
Then properly handle the compilation, publish the process and then it's done!
PS: The corresponding code has been published in https://github.com/zmofei/point-map. Interested partners can read the source code by themselves or directly use it through NPM and CND.